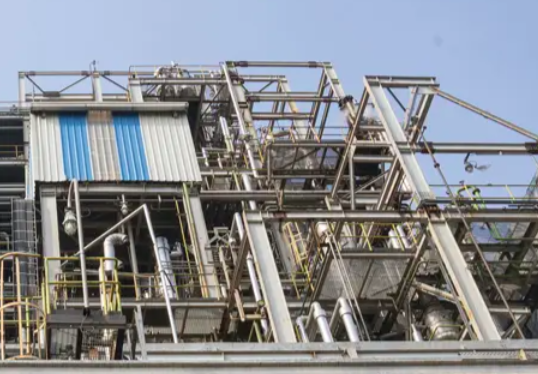
Hey there, fellow investors and financial enthusiasts! In the ever-evolving world of investing, it’s not just about crunching numbers; it’s about spotting those hidden gems that could potentially skyrocket your portfolio. One such gem that’s been on our radar is Vinati Organics Ltd. This company, known for its specialty organic chemicals, has been quietly making waves in the market.
First up, we’ve got the export business. It’s gearing up to make a triumphant return this quarter. Vinati Organics is all set to spread its wings globally, and that’s bound to shake things up.
But that’s not all! There’s another plot twist in this financial drama. The company is eyeing a bounce-back in demand for its star product, ATBS (2-acrylamido 2-methyl Propane Sulphonic Acid), during the second half of the year. This comes after a rollercoaster ride of demand ups and downs.
In this article, we’re going to unravel these crucial developments and figure out how they might send Vinati Organics’ share price on a rollercoaster of its own. By the time you finish reading, you’ll have a crystal-clear picture of what’s in store for Vinati Organics and how it might just influence your investment decisions. So, fasten your seatbelts, and let’s explore the exciting journey ahead!
About Vinati Organics
Vinati Organics Ltd, established in 1989, is a well-respected manufacturer specializing in organic intermediaries and monomers. Their extensive product range includes monomers, specialty aromatics, miscellaneous polymers, butyl phenols and other specialized items, serving a wide range of industries.
Vinati Organics is a market leader, known for being the sole backward-integrated manufacturer of ATBS and butyl phenols due to its Isobutylene manufacturing unit. It holds a substantial market share of over 65% in ATBS and IBB production and serves esteemed clients like BASF Corporation, Dow Europe GMBH, Mitsubishi Corporation, SNF, and Chemtall Inc .
The company strategically merged with Veeral Additives Private Limited, expanding its product portfolio to include antioxidants for plastics and polypropylene. Vinati Organics’ global footprint extends to countries such as the USA, Australia, China, Germany, France, Italy, Japan, South Korea, Thailand, Malaysia, and more.
In FY22, the majority of the company’s revenue came from product sales, with additional income from foreign exchange, interest, and financial assets. With ambitious growth plans, including capacity expansions and the introduction of new products, Vinati Organics is well-positioned for continuous growth within the specialty organic industry.
Q1 Fy2024 Key Points And Summary:
- Q1 FY2024 Declines: Q1 FY2024 saw a 15% drop in revenue compared to the previous year, accompanied by a 15% to 17% decline in EBITDA and PAT.
- Antioxidant Business: The antioxidant business operated at 25% capacity in Q1 FY2024 due to demand pressures, but it holds a promising long-term outlook.
- Revenue Mix: In Q1 FY2024, revenue composition was ATBS (40%), IBB (20%), and butyl phenols (17%).
- Margins: Q1 FY2024 maintained a 28% margin, but expectations point to lower margins in the butyl phenols and antioxidants segments for the year.
Vinati Organics Share Price Target 2023 To 2030
Vinati Organics Share Price Target 2023
| When | Maximum Price | Minimum Price |
| September 2023 | ₹1,890.72 | ₹1,718.84 |
| October 2023 | ₹1,883.65 | ₹1,685.13 |
| November 2023 | ₹1,907.30 | ₹1,652.09 |
| December 2023 | ₹1,927.27 | ₹1,706.61 |
The table provides the expected share prices for the months of September 2023 through December 2023.
- The maximum price for the year is ₹1,927.27, which is expected to occur in December 2023.
- The minimum price for the year is ₹1,1716, which happened in March 2023.
So, the maximum and minimum share prices for the year 2023 are ₹1,927.27 and ₹1,1716, respectively. These values represent the highest and lowest points in share price expectations for the entire year.
Vinati Organics Share Price Target 2024
| When | Maximum Price | Minimum Price |
| January 2024 | ₹1,915.58 | ₹1,665.72 |
| February 2024 | ₹1,954.68 | ₹1,699.72 |
| March 2024 | ₹1,994.57 | ₹1,734.41 |
| April 2024 | ₹1,936.47 | ₹1,683.89 |
| May 2024 | ₹1,907.86 | ₹1,659.01 |
| June 2024 | ₹1,976.54 | ₹1,718.73 |
| July 2024 | ₹1,956.77 | ₹1,701.54 |
| August 2024 | ₹2,035.04 | ₹1,769.60 |
| September 2024 | ₹2,116.45 | ₹1,840.39 |
| October 2024 | ₹2,074.95 | ₹1,804.30 |
| November 2024 | ₹2,137.20 | ₹1,858.43 |
| December 2024 | ₹2,190.63 | ₹1,904.89 |
To analyze the share prices for the year based on the our analysis, we can consider the data for the entire year:
- The maximum price for the year is ₹2,190.63, which is expected to happen in December 2024.
- The minimum price for the year is ₹1,659.01, to reach in May 2024.
So, the maximum and minimum share prices for the year 2024 are ₹2,190.63 and ₹1,659.01, respectively. These values represent the highest and lowest points in share price expectations for the entire year.
In summary, the table illustrates the volatility of the stock’s share price throughout the year 2024. Volatility can present both opportunities and risks for investors, as they navigate the fluctuations in the market to make informed decisions about buying or selling shares.
Vinati Organics Share Price Target 2025
| when | Maximum Price | Minimum Price |
| January 2025 | ₹2,234.44 | ₹1,718.80 |
| February 2025 | ₹2,291.73 | ₹1,762.87 |
| March 2025 | ₹2,381.11 | ₹1,831.62 |
| April 2025 | ₹2,334.42 | ₹1,795.71 |
| May 2025 | ₹2,266.43 | ₹1,743.41 |
| June 2025 | ₹2,368.42 | ₹1,821.86 |
| July 2025 | ₹2,321.98 | ₹1,786.14 |
| August 2025 | ₹2,393.79 | ₹1,841.38 |
| September 2025 | ₹2,477.57 | ₹1,905.83 |
| October 2025 | ₹2,541.99 | ₹1,955.38 |
| November 2025 | ₹2,605.54 | ₹2,004.26 |
| December 2025 | ₹2,670.68 | ₹2,054.37 |
Analyzing the table of expected share prices for each month in 2025, we can determine the maximum and minimum share prices for the entire year:
- The maximum price for the year occurred in December 2025, with a value of ₹2,670.68.
- The minimum price for the year was observed in January 2025, with a value of ₹1,718.80.
These values represent the highest and lowest points in share price expectations for the entire year 2025. It’s evident that the share price experienced significant fluctuations over the course of the year, with an upward trend overall. This information can be valuable for investors and analysts assessing the stock’s performance and potential opportunities or risks in the coming year. Despite the overall upward trend, the stock exhibited notable volatility, with fluctuations in prices from month to month. This volatility suggests that investors should be prepared for occasional price swings and carefully manage their investment strategies.
Vinati Organics Share Price Target 2026 To 2030
| Year | Maximum Price (₹) | Minimum Price (₹) |
|---|---|---|
| 2026 | ₹2,804.21 | ₹1,962.95 |
| 2027 | ₹3,084.63 | ₹2,159.24 |
| 2028 | ₹4,318.49 | ₹2,159.24 |
| 2029 | ₹3,738.95 | ₹1,869.48 |
| 2030 | ₹4,860.64 | ₹3,402.45 |
Over the span of five years, from 2026 to 2030, the company’s share price displayed a changing pattern. In 2026, it ranged from a high of ₹2,804.21 to a low of ₹1,962.95. The subsequent year, 2027, saw prices rise, reaching ₹3,084.63 at its peak and ₹2,159.24 at its lowest, reflecting an upward trend. In 2028, there were significant price swings, hitting a high of ₹4,318.49 while maintaining a low of ₹2,159.24. 2029 experienced a minor decrease, with prices ranging from ₹3,738.95 to ₹1,869.48, indicating some fluctuations. Finally, in 2030, the share price surged remarkably, reaching a high of ₹4,860.64 and a low of ₹3,402.45. These changes and upward trends in share prices throughout the five-year period present opportunities for investors to navigate the evolving market conditions and potentially benefit from substantial gains in the stock’s value.
Vinati Organics Financial Condition (Last 5 Years)
| Mar 2019 | Mar 2020 | Mar 2021 | Mar 2022 | Mar 2023 | |
| Sales + (Crores Rs.) |
1,128 | 1,029 | 954 | 1,616 | 2,078 |
| Expenses + (Crores Rs.) |
703 | 614 | 601 | 1,180 | 1,482 |
| Operating Profit (Crores Rs.) |
425 | 415 | 353 | 435 | 596 |
| OPM % | 38% | 40% | 37% | 27% | 29% |
| Other Income + (Crores Rs.) |
30 | 45 | 26 | 61 | 72 |
| Interest (Crores Rs.) |
2 | 2 | 1 | 2 | 2 |
| Depreciation (Crores Rs.) |
27 | 33 | 43 | 45 | 52 |
| Profit before tax (Crores Rs.) |
425 | 425 | 335 | 449 | 615 |
| Tax % | 34% | 21% | 20% | 23% | 26% |
| Net Profit + (Crores Rs.) |
282 | 334 | 269 | 347 | 458 |
| EPS in Rs | 27.48 | 32.48 | 26.2 | 33.73 | 44.56 |
| Dividend Payout % | 13% | 17% | 23% | 19% | 16% |
- Sales: The company’s sales have shown consistent growth, increasing from ₹1,128 million in March 2019 to ₹2,078 million in March 2023. This indicates strong revenue expansion over the years.
- Expenses: While sales grew, expenses also increased, but the growth rate in expenses appears to have been well-managed, considering the substantial increase in sales.
- Operating Profit Margin (OPM): The operating profit margin has shown some fluctuations but has generally remained healthy, ranging from 27% to 40%. It dipped in March 2022 but rebounded in March 2023, indicating effective cost management.
- Other Income: The company has been generating additional income from sources other than its core operations. This income has gradually increased over the years, reflecting diversification in income streams.
- Profit Before Tax (PBT): The profit before tax has steadily grown, reflecting the company’s improving profitability. It increased from ₹425 million in March 2019 to ₹615 million in March 2023.
- Tax Percentage: The tax rate has fluctuated but remained reasonable, with the lowest rate at 20% in March 2021 and the highest at 34% in March 2019. It has generally been well-managed.
- Net Profit: The net profit has shown consistent growth, increasing from ₹282 million in March 2019 to ₹458 million in March 2023. This reflects the company’s ability to generate profit after taxes.
- Earnings Per Share (EPS): The EPS has increased steadily, indicating the company’s ability to generate more earnings per share for its shareholders. It reached ₹44.56 in March 2023.
- Dividend Payout Percentage: The dividend payout percentage has seen fluctuations but has generally been reasonable, ranging from 13% to 23%. It indicates the company’s willingness to distribute profits to shareholders while retaining a portion for growth.
In summary, the company has demonstrated consistent revenue growth, effective cost management, and improving profitability over the five-year period. The stable interest and depreciation expenses, along with reasonable tax rates, contribute to its financial stability. These factors, coupled with a gradually increasing EPS, suggest a positive financial outlook for the company.
FAQs
What is the current market valuation of Vinati Organics Ltd.?
The current market valuation of Vinati Organics Ltd. stands at ₹18,685 Crores.
What Is The Target Share Price For Vinati Organics By 2025?
The target share prices for the year 2025 ranged from a minimum of ₹1,718.80 in January to a maximum of ₹2,670.68 in December.
What Is The Target Share Price For Vinati Organics By 2030?
The target share price for the year 2030 is expected to be within the range of ₹3,402.45 (minimum) to ₹4,860.64 (maximum) based on the historical data from 2026 to 2030.
What Is the Trend in Return on Equity (ROE) Over the Past Few Years for Vinati Organics Ltd.?
The Return on Equity (ROE) for Vinati Organics Ltd. has shown a consistent and positive trend over the years. Over the past 10 years, it averaged at 24%, indicating strong returns generated for shareholders. In the last 5 years, the ROE remained robust at 23%, and over the past 3 years, it maintained a solid performance at 21%. In the most recent year, the ROE was at 23%. The current ROE stands at 22.6%, highlighting the company’s continued efficiency in utilizing shareholder equity to generate profits. This consistent trend in ROE suggests that Vinati Organics has been effectively maximizing returns for its shareholders over the years.
Should One Invest in Vinati Organics?
Investing in Vinati Organics seems promising due to its strong financial performance. The company’s proactive debt reduction has made it almost debt-free, which is a good sign for its financial stability. They also maintain a healthy dividend payout of 19.3%, showing their commitment to rewarding investors. Moreover, their efficient management of working capital, reducing it from 126 days to 99.7 days, reflects operational efficiency.
However, there are factors to consider. The stock’s trading price is relatively high at 8.42 times its book value, and it has experienced significant price fluctuations. With a market capitalization of ₹18,685 Crores, it might not be suitable for all investors. Additionally, valuation metrics like a P/E ratio of 42.5 and a low dividend yield of 0.39% should be carefully reviewed.
Despite these points, Vinati Organics shows strong return metrics, including a 30.4% ROCE and a 22.6% ROE, indicating efficient capital utilization. Therefore, potential investors should conduct thorough research, evaluate their risk tolerance, and align their investment goals with the stock’s characteristics before making any investment decisions.


